Working with Published Reports
When you are using Published Reports in CALUMO, there are some basics that you need to know to be able to navigate around the reports with ease.
Selectors
There are two types of selectors you can be given to use when working with reports; drop down selectors and member list selectors.
Note
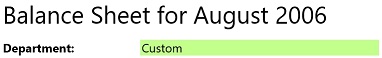
Depending on whether your report is set up to auto refresh with changes to selections, you may need to use the update/refresh function to alter selections.
These changes will appear highlighted green prior to updating, see below example:
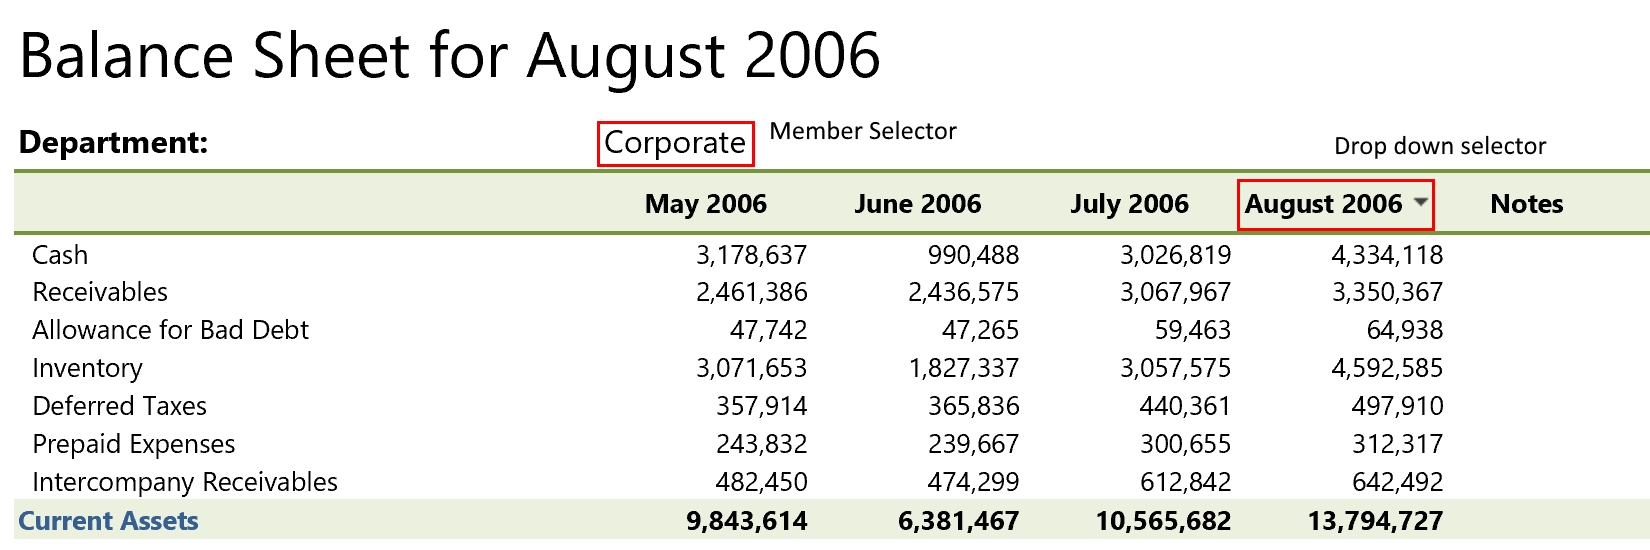
Drop down selectors
The drop down selector shows you the list of items you can select from in a flat or hierarchical list.
To use a drop down selector:
- Select the drop down arrow
- After the other members appear, select the members you would like to view in the report.
In the case below, it is a simple flat selector allowing you to select a month and year.

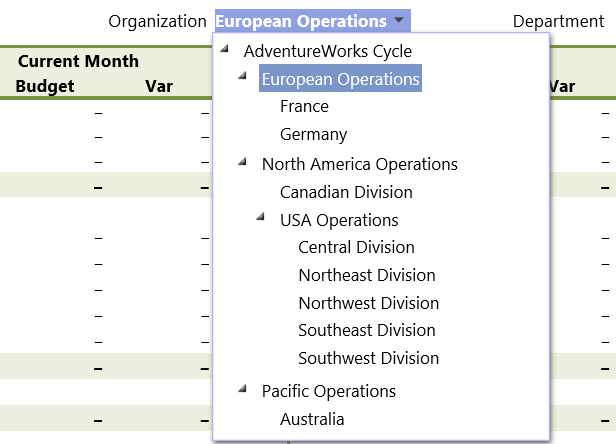
In the next example pictured below, the drop down has multiple levels. When using this style of drop down, you can navigate through the levels using the arrow on the left of a given item to expand or collapse its children.
Member List Selectors
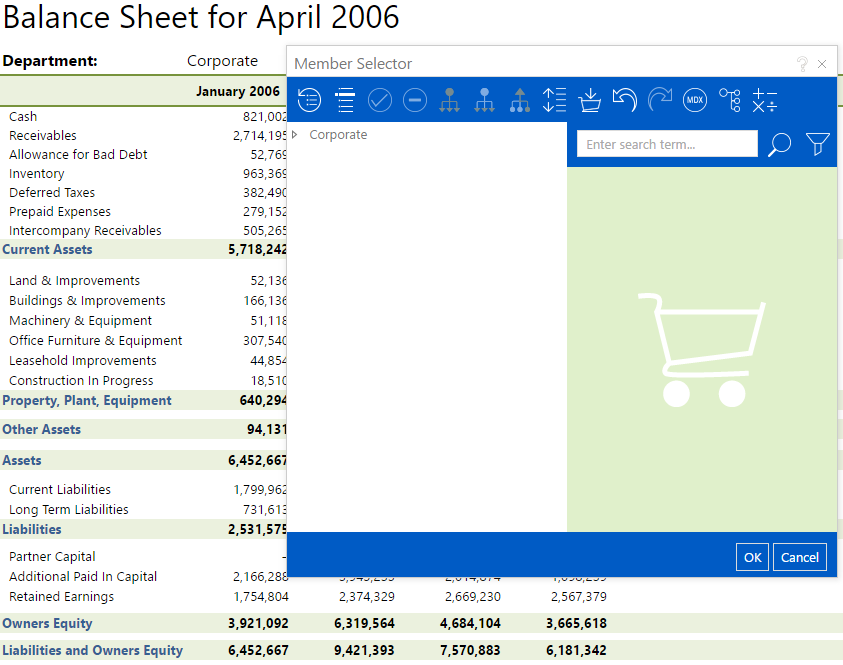
If the list of selections is large, the report may have been setup to use the Member List selector which uses Member Explorer as a mechanism for selecting the item. The following image shows how this type of selector will appear on the report.
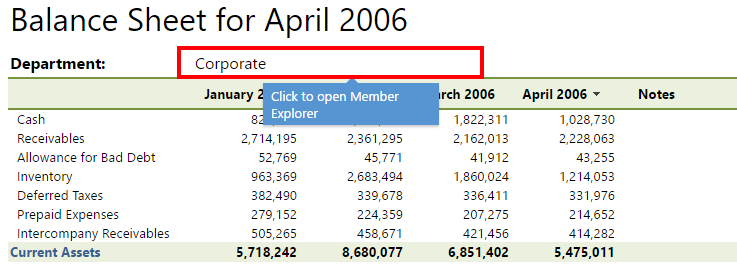
As seen in the image below, after clicking the selector area you will be directed to the member selector.
Selecting Corporate produces a list of all of the descendants, allowing you to choose the member of the hierarchy you wish to view.
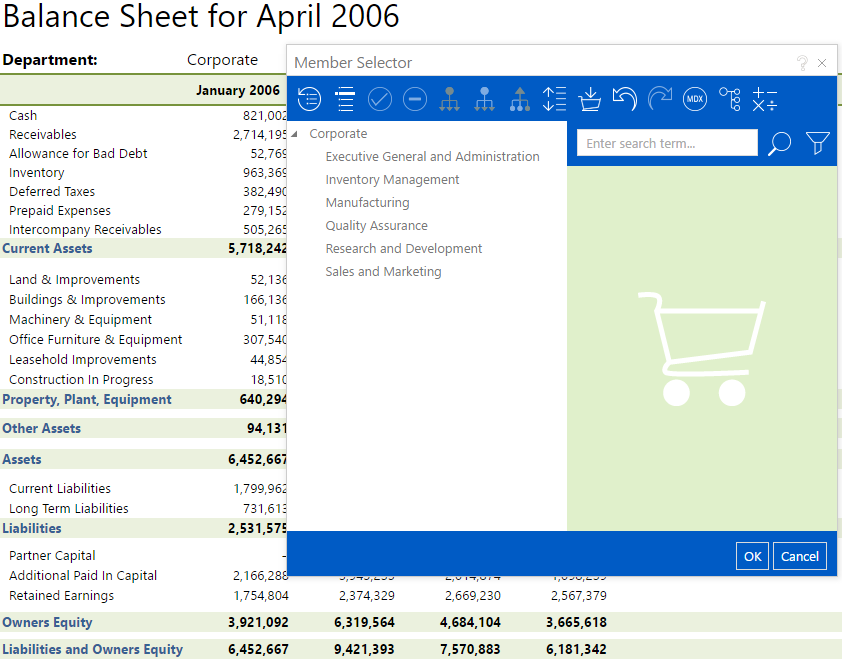
For more information about using the toolbar to select and navigate your hierarchy refer to Member Explorer Toolbar.
Editors
On a Published Report, there are several types of editors that are used depending on the formulas used by the report designer.
Numeric Inputs
Where a cell in a Published Report is showing a numeric value from your underlying data and it is editable, a numeric input box will show when you select the cell.
Rich Text Notes
Depending on the way that your report has been configured, you may be able to write notes to provide annotations, commentary or context for data displayed in a report.
In order to write notes, select the blank space that appears below ‘notes’ and begin typing (formatting options will also appear above for font and sizing).
Note
In order for notes to be written back, ensure you select update/refresh before altering your selections or drop downs in the report.
For more information on how to use rich text notes refer to Rich Text Notes.
Drill Down / Through
Depending on the depth of analysis offered by a report you may be able to drill down and through to view subsets of data or transactions that contributed to particular data points1.
Drilling down allows you to navigate further down an existing hierarchy of data that is on the report. e.g. Drilling down through regions Australia> NSW> Sydney.
Drilling through on the other hand is about drilling from a number (data point) through to the transactions that made up that data point or to related information about it.
Drill Down
By selecting particular terms from the left column, you can expand the data point (drill down). As seen below in the Balance Sheet for March 2006, by selecting Current Liabilities, the specific liabilities that make up that data point are expanded out providing the members of the hierarchy. This is seen in the second image which shows a breakdown of Current Liabilities.


Drill Through
In order to gain even greater understanding, you can also drill through to the transactions for a particular data point.
Once you have selected a cell, move to the toolbar pictured on the top left of your screen and select the drill through icon from.
-
Select a cell (will glow blue)

-
Select the ‘Drill to transactions’ icon from the report toolbar (highlighted in red). Read more about the tool bar.

-
After selecting ‘Drill to transactions’, you will be taken to a separate tab containing more granular information about the data point selected. Depending on the way your report has been configured, this tab may also contain additional tabs containing more information related to the data point. In the example below, the Financial Transactions tab has been added to allow for greater context for the selected data point.
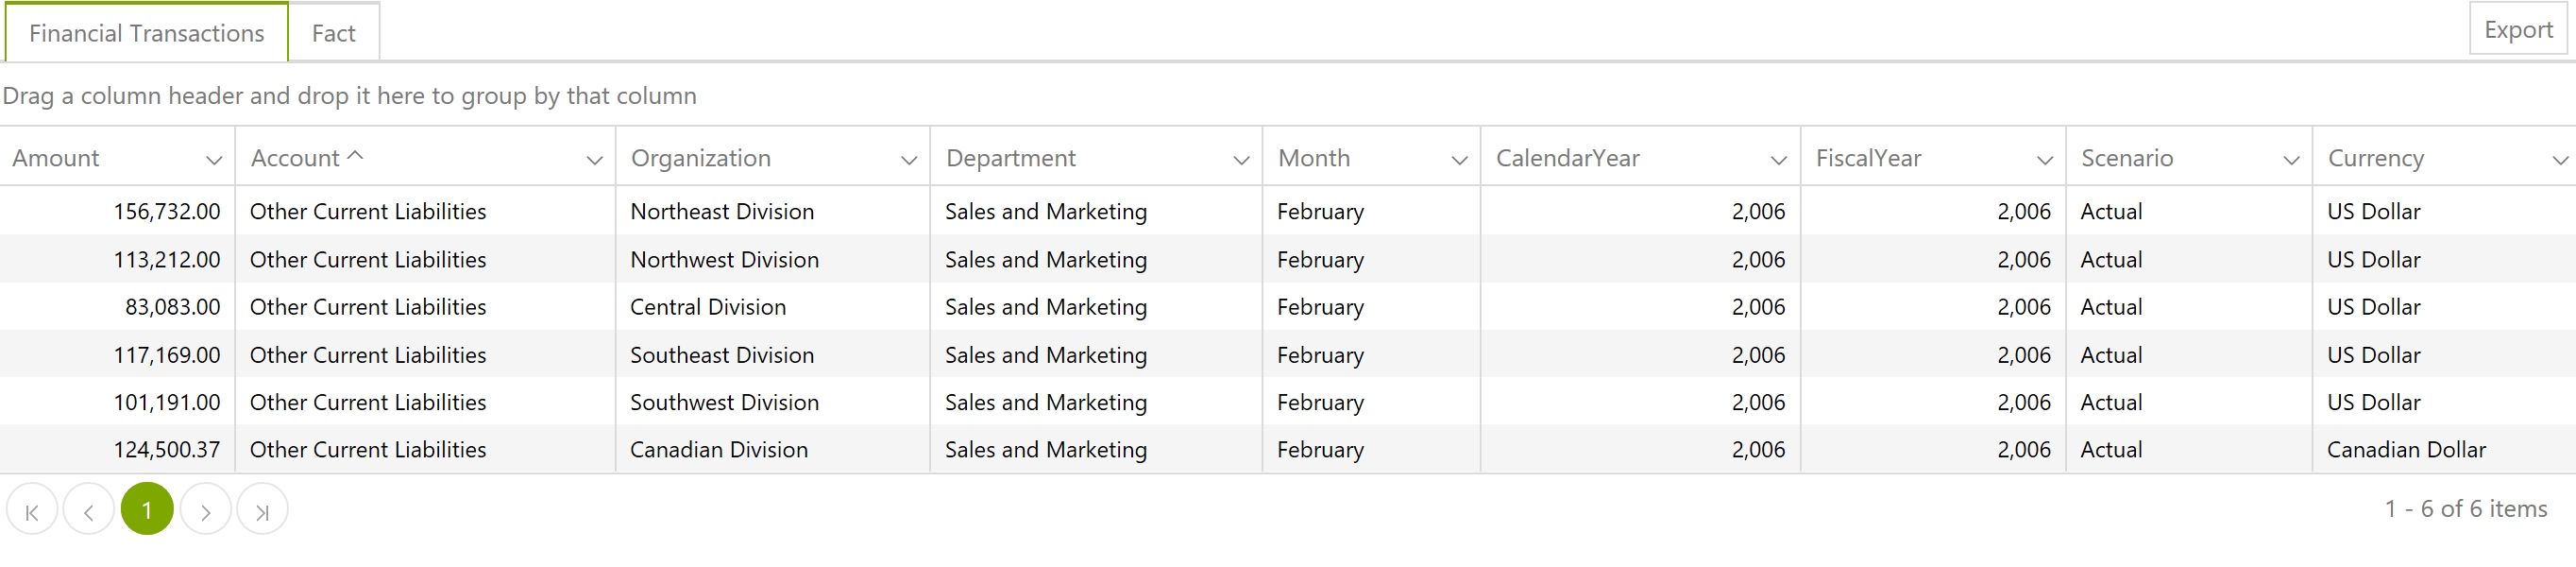
Drill To Transactions Window
The ‘Drill to transactions’ window allows you to use drop down arrows to sort and filter the data. You can sort the data according to a particular column (ascending/descending, amount, account, organisation, department etc). This is particularly useful when drilling to transactions for cells which are aggregates of large numbers of transactions with varying accounts, organisations, months, departments or currencies.
You can also isolate particular columns by selecting the drop down arrow for any column (does not need to be the column that you wish to remove/add) and selecting and deselecting the boxes on the left of the columns you wish to add or remove.
Depending on the way your report is set up, when drilling to transactions you may also be taken to other pages with related information from external sources.
-
Data point - Value expressed in a selected cell reflecting the intersection in the cube of a set of members from different hierarchies ↩