Ensuring IIS is Configured to Compress the Correct Mime Types
This is applicable for IIS 7 and greater.
One of the great benefits of IIS is its ability to do compression on dynamic requests being sent to the client.
In IIS we turn this on as part of the CALUMO Web Server installation, but sometimes it is worth checking to see that everything is configured correctly because this compression can really tune up performance.
Ensure Dynamic Compression Is Enabled in IIS
Firstly, open up the IIS Manager on the CALUMO Web Server, navigate down to your CALUMO application and double click on the “Compression” feature. In this feature, ensure that both Static and Dynamic compression are on and if they are not, check them both on and click Apply on the right hand side of the window.
Ensure That the Correct Mime Types Are Registered For Dynamic Compression
You will need full administration rights on the server to perform this action.
Next, we have to get down into the core configuration files for IIS. Firstly, take a backup of the following file and then open the original in your favorite text editor:
c:\\windows\\system32\\inetsrv\\config\\applicationHost.config
Search this file for the following section:
<httpCompression>
In here you will see two sections named “staticTypes” and “dynamicTypes”. If all went well with the CALUMO Web Server installation, you should see that the following is in the “dynamicTypes” section
<add mimeType="application/json" enabled="true" />
If it is not, add it in as the first item, e.g.
 <dynamicTypes>
    <add mimeType="application/json" enabled="true" />
    <add mimeType="text/*" enabled="true" />
    <add mimeType="message/*" enabled="true" />
    <add mimeType="application/x-javascript" enabled="true" />
    <add mimeType="application/javascript" enabled="true" />
    <add mimeType="*/*" enabled="false" />
</dynamicTypes>
Save the file and perform an IIS reset at an administrator command prompt.
Check That Compression Is Working
The easiest way to check this is to use the Development Tools in the Chrome Browser, as it shows the size of requests with both compressed and uncompressed numbers.
- Open Chrome and navigate to a report directly and then press F12 to open developer tools.
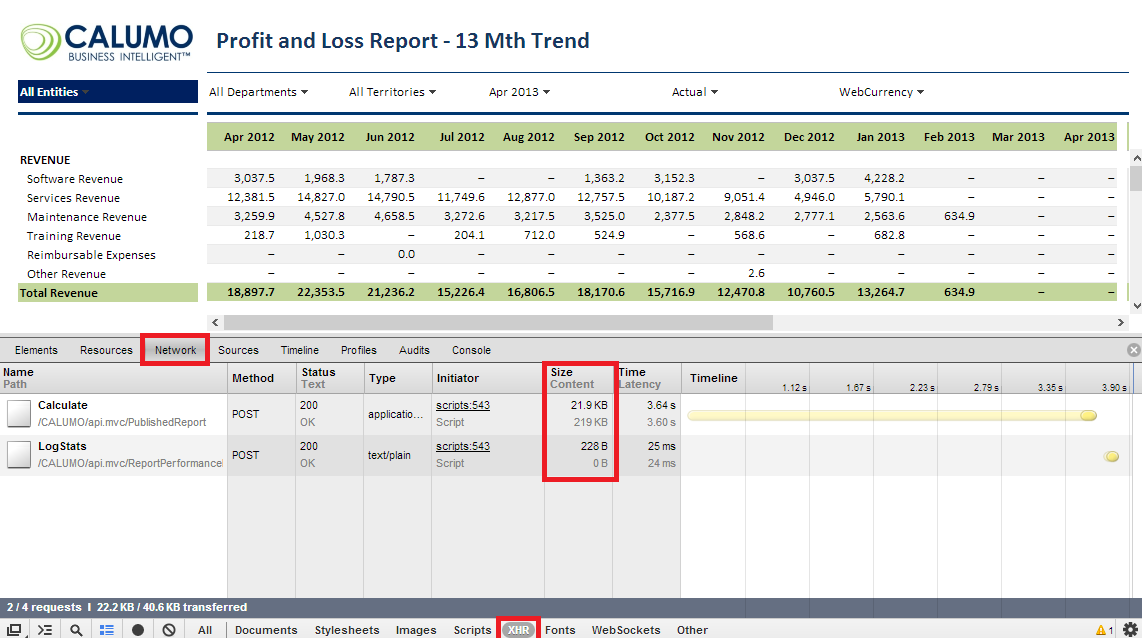
- Once development tools are open, go to the Network area and then choose XHR along the bottom.
- Refresh the report and look at the Size column as highlighted in the screenshot below (click to expand the image):

You should see for the Calculate request two numbers, the one in grey is the uncompressed size (in this case it is 219KB) and the one in black is the compressed size (21.9KB), which as you can see are quite different.
If they are not different, then the change has not been successful, or the IIS server needs to be reset again to pickup the change.