Creating a CALUMO SPARK
How to create a CALUMO SPARK
There are three methods of creating a new SPARK:
- The CALUMO SPARKS Wizard
- Microsoft Excel function helper
- Manually typing a CALUMO SPARKS formula
The easiest method of creating a new CALUMO SPARK is to use the CALUMO SPARKS Wizard, although we will step through creating a CALUMO SPARK using each of these methods.
Using Wizard
To create a new SPARK:
- Open an Excel worksheet and place your cursor in the cell where you would like to store the CALUMO SPARKS formula
- Re-size the cell so that it fits your chart. To create a larger chart, you can merge cells
- Click on the CALUMO SPARKS Wizard button
- Select the SPARK type from the SPARK selector panel
- Edit the SPARK properties by clicking in the fields in the SPARKS properties panel
- When you have completed your edits, click OK to close the CALUMO SPARKS Wizard and view your chart
The SPARK is generated and appears in the Excel sheet in the cell specified.
Using Excel Function Helper
If you wish to create a new SPARK using the Excel Function Helper, you can do so using the Excel Insert Function tool. In Excel, you will find a CALUMOCellCharts.Functions option which produces a window where you can manually enter Function Arguments data.
To create a new SPARK using the Excel Function Helper:
- Click on the fx button on the bottom of the ribbon to produce the Insert Function window
- Click on the category selection drop-down menu and choose CALUMOCellCharts.Functions from the list
- Select a function (SPARK)
- Click OK
- The Function Arguments window is displayed
- Complete the form with the function arguments specific to this chart (shown CCAXIS)
- Click OK
The SPARK is generated within the specified cell.
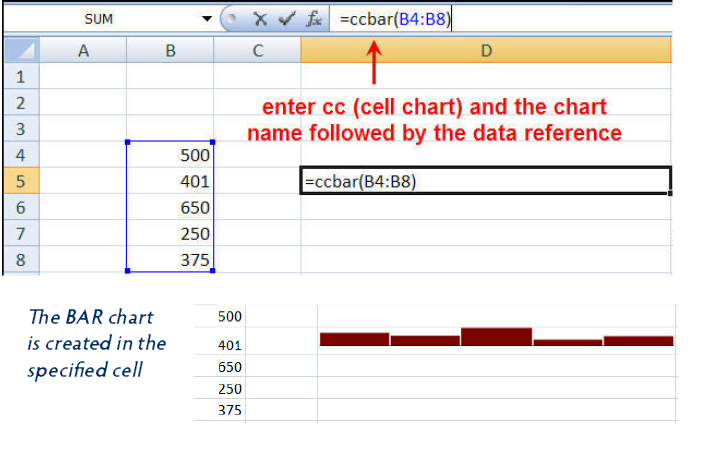
Manual Creation
Power users may be interested in knowing how to manually create SPARKS formulas. These formulas can be typed directly into Excel.
- On your Excel spreadsheet, type ‘=’ followed by ‘cc’ and the chart type (‘bar’ in this example)
- Select or type in the data reference points and press the Enter key