Creating your First Chart
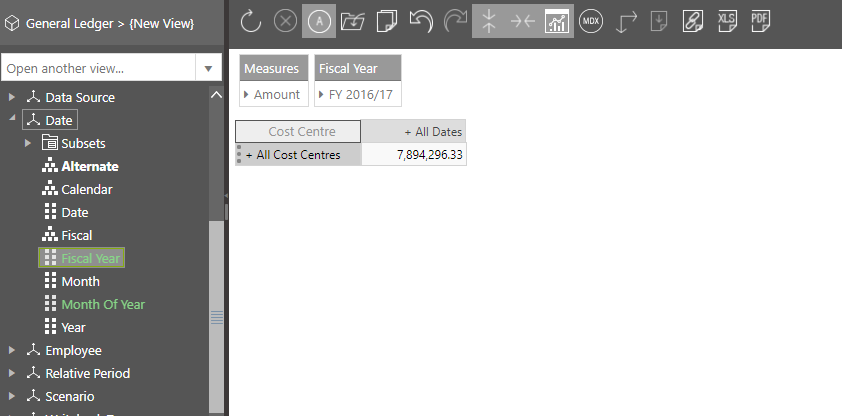
Having exposed the most rudimentary view, an entry on rows, columns and slicers returning one number like the following, you are only one click away from your first chart:
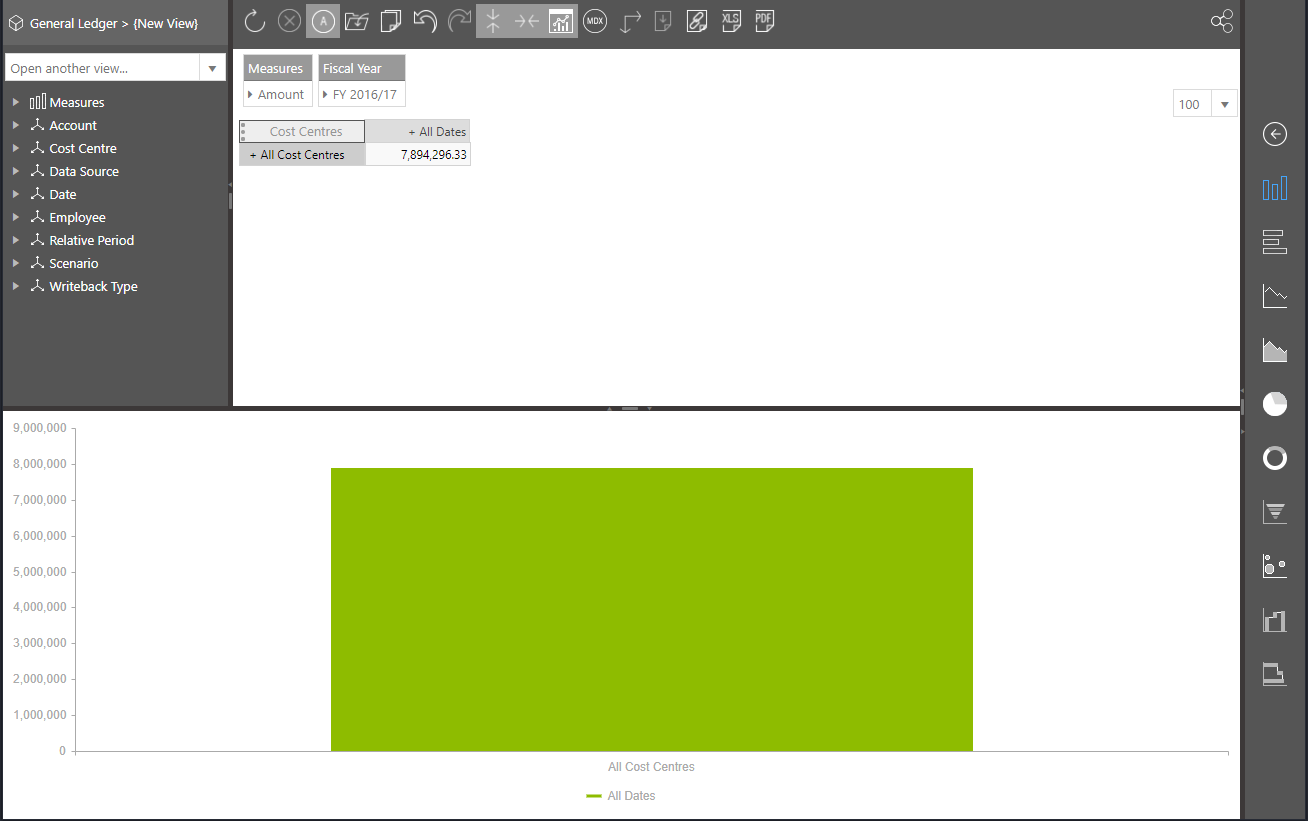
Click on the Visual Data Discovery icon on the toolbar, the one that looks like a chart. This will change your view mode to “Design Slim” and you will get a single column column chart
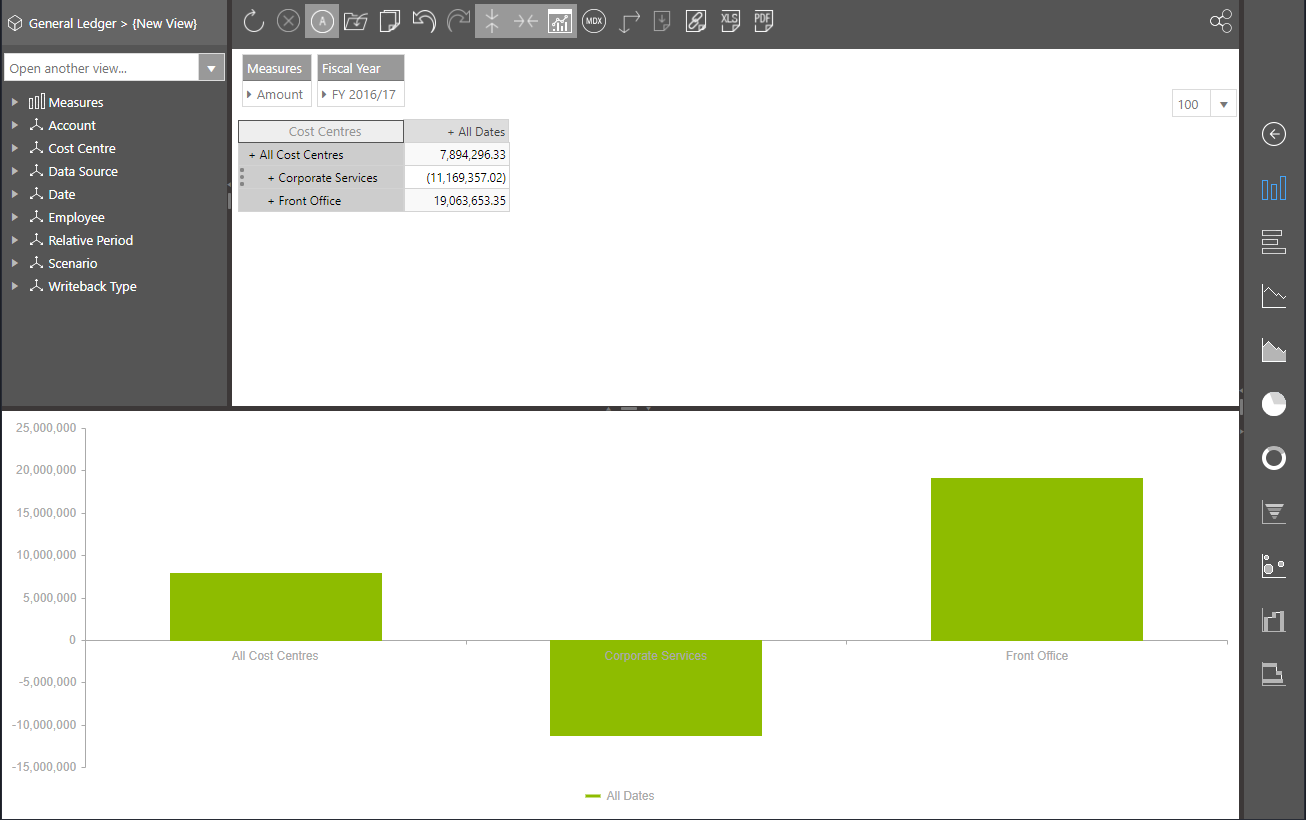
Now you can either drill down on your row members or click on the columns in the charts to start navigating through your data. In this example, I have clicked on the single column in the chart.