Dimension stacking
When you have a view that has multiple hierarchies stacked on rows or columns, the data point for a given point in the chart is the intersection of the inner most hierarchy on rows and the inner most hierarchy on columns.
So as to ensure that you can create the context for your data that you want, when labelling the data point, all the stacked hierarchies are used to create the label.
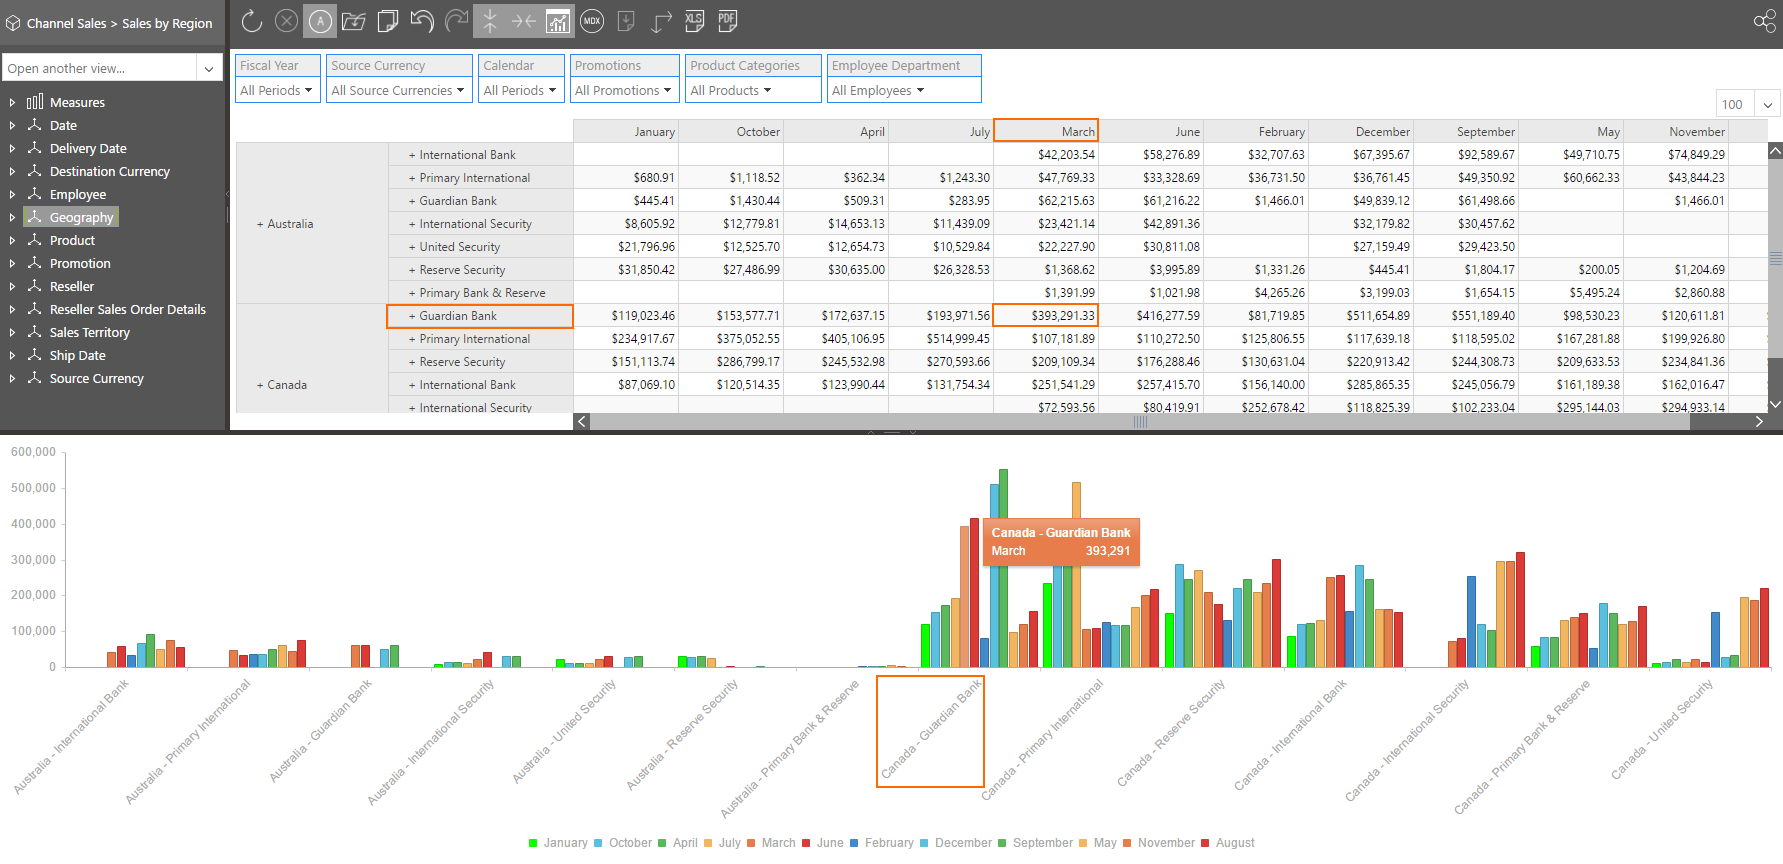
The following example shows how this works. If you look at the highlighted sections you will see that the context of the data point is shown in the axis labels and hover tooltips