CREPORTSUPPRESS
The CREPORTSUPPRESS formula allows you to select a range and an Axis/Axes that will have suppression applied.
To determine suppression, we look for one of the following conditions to be true:
- The cell value is
null(Note: this is not the same as the text value NULL that can come back from Analysis Services) - The cell value is
""(an empty text value) - The cell value is
0
If all the cells in the axis to be suppressed for the given range are one of the above values, then that entire row or column will be suppressed (hidden).
Another important feature of this formula is that when it is shown in a published report, it will display as a drop-down list that you can use to change the suppression type on the fly for your report.
Syntax
CREPORTSUPPRESS (SuppressionType, CalumoFormulaOnly, OnlyGiveOnOffChoiceInList, SuppressionRange1,…, SuppressionRange20)
Arguments
SuppressionType : string (required)
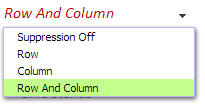
Specify the axis that you want to suppress on.
The valid options are:
"None",
"Row",
"Column",
"RowAndColumn"
Default value: "None"
CalumoFormulaOnly : boolean (required)
Whether or not to only look at cells with CALUMO formula in them when determining whether to suppress.
Default value: false
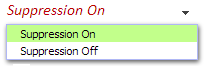
OnlyGiveOnOffChoiceInList : boolean (required)
When the formula is visible in a Published Report it renders as a drop list of items. The list will either show all the valid Suppression Types (false) or it will only show “Suppression On” and “Suppression Off” (true).
When you set this option to true, selecting “Suppression On” will apply the current Suppression Type and “Suppression Off” will clear all suppression.
Default value: false
SuppressionRange1 : string (required)
Select the range of cells to be suppressed.
SuppressionRange2 - 20 : string
Select up to 19 more ranges to be suppressed.
The benefit of having multiple ranges evaluated in one formula is when you make the cell containing the formula visible in a Published Report, the choice you make in the list will be applied to all specified ranges.
If you want to have suppression on ranges independent of each other, just use multiple instances of this formula.
Usage Scenarios
Suppression is commonly used to make sparse data more readable by hiding all the information that has no meaning to the current set being observed.
Take for example a set of product data that has region specific products, when you change regions you will get lots of blank areas in your report for products that are not sold in the current region. Using suppression on this report will mean that as you change region, the products that are not sold in that region will be hidden and your report will just show you the relevant data.
Examples
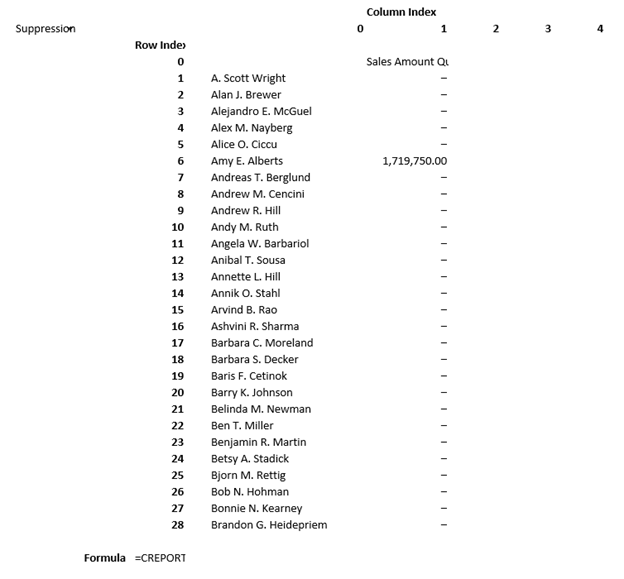
The following example shows a worksheet with suppression off and then suppression on.
Suppression is off in this image and you can see that there are 3 columns, January, March and April that should be suppressed if we have suppression on Columns.

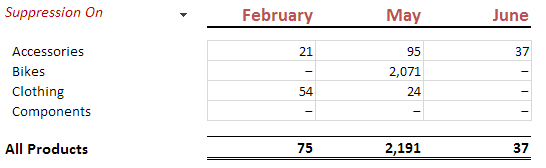
Suppression is on for Columns in this image and you can see that the 3 columns, January, March and April are now suppressed.
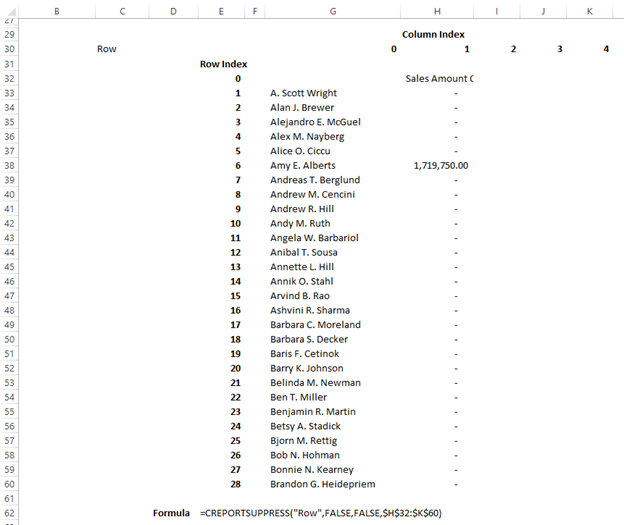
In Excel, our second example appears as:
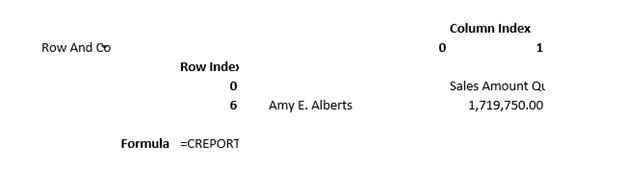
Upon publishing, it appears as:

Changing SuppressionType to "RowAndColumn" produces:
SUPPRESSION OFF returns the original view seen in Excel: