Reflex Reporting
CALUMO offers you the additional functionality of integrating dynamic content from MDX statements into your Excel or web-based reports.
For example, in cases when your member selection in a report produces a varying amount of rows in your MDX result, or a user-driven Top N report that allows a user to choose what N is – you can use CALUMO’s reflex reporting functionality to produce consistently formatted reports that are updated dynamically.
As with all CALUMO data formulae, writeback is available in reflex reporting for both web and Excel reports (subject to privileges).
Create a Reflex Report
To create a reflex report:
- Open Excel, ensuring that your MDX statement is available
- Enter your MDX statement into your Excel worksheet (any cell)
- Enter your CREFLEX formula into any unpopulated cell.
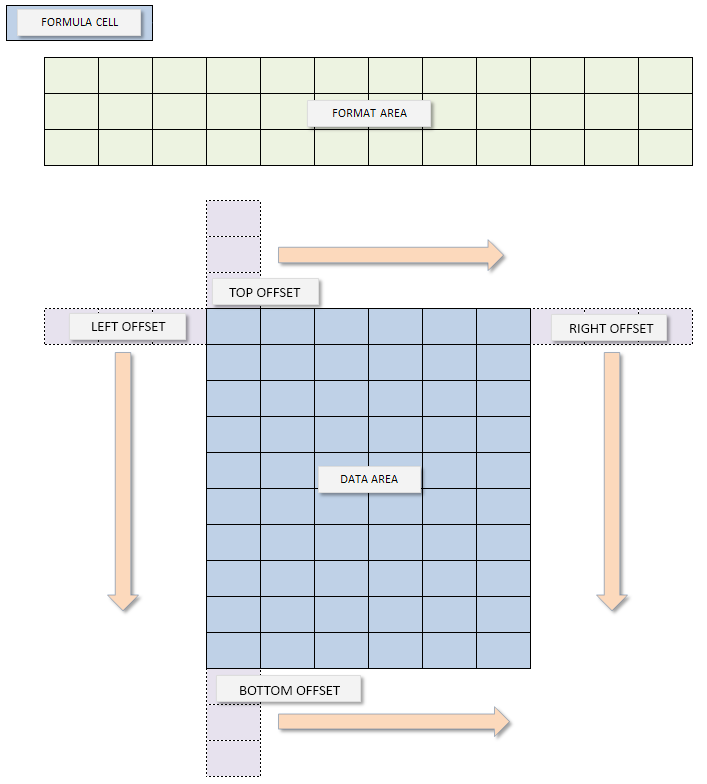
- Select the top left cell of where the data in your report will begin. Add this to your CREFLEX formula (DATARANGE)
- Select the format area by dragging your mouse into a box shape (separate to your report area), then add this to your CREFLEX formula (FORMATRANGE)
- Select the number of cells to be offset for top, bottom, left and right.The offset area copies and pastes anything cell-based such as a formula, formatting, or SPARK formula, down and across the columns and rows
- Set the maximum number of rows and columns for your report. Enter -1 in the MaxRows formula for “all rows” and -1 in the MaxCols formula for “all columns”
- If your MDX returns no data for a cell, the default is for SSAS to return the word NULL. NULL can be replaced with the value of your choice. Entering double quotes (” ”) leaves null value cells blank
Setting Formatting Rules
You must create a reference table with formatting instructions. For added granularity, you can add more than one reference table. A value in the reference table that matches a value in the same row of the report will copy the format from the reference table to the report.
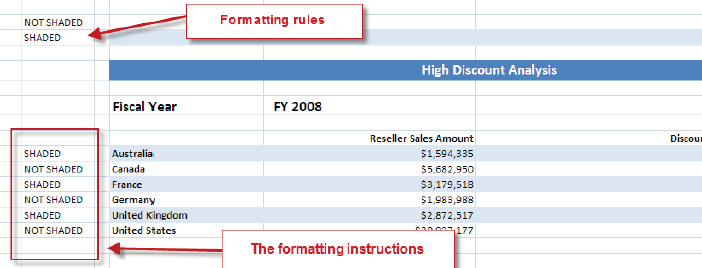
For example, the following report shades alternating rows. In the left offset area, a formula has been added to determine whether the row is even (SHADED) or odd (NOT SHADED). This is your formatting rule for each row.
=IIF (ISEVEN(ROW()), "SHADED", "NOT SHADED")
In the format area, use the Excel formatting tools to format your rows in the style you wish (bold, italic, red, green, etc). In the left format area, the example shows the formatting instructions (SHADED OR NOT SHADED), which matches the formatting rule.